How to use Data to Make a Hit TV Show: TED Talk

Just like getting stuck in a good book, I love getting sucked into a good tv show. When I was doing my undergraduate thesis I managed to get through 7 seasons (40mins each, 22 episodes per season) of the West Wing between April and early July. It probably wasn't the best idea, but, hey, I enjoyed it and it was great for stress relief. At the moment, there are about 5 or 6 shows that I watch religiously and can often be found binge watching a new show at the weekend.
So, naturally, I was drawn to this TED Talk on ‘How to use data to make a hit TV Show’. It’s a fascinating area. Now, my brain is just analytical enough to do my job, but not big data level, but as noted by, Sebastian in the talk, data is moving rapidly into our everyday lives.
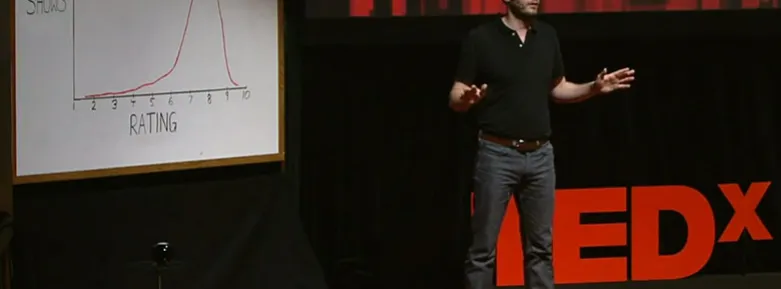
In the talk, Sebastian compares the successes of Netflix to the failures of Amazon when making a TV show based on data. Both compare millions of data points from their users to come to a conclusion on what kind of TV show would be successful. The only difference is that Amazon uses only data, but Netflix uses people to bring all the data together.
Check out the talk here:
To continue on the data for TV shows, Netflix recently released a study on The Power of a Picture. I know that I can spend at least 20mins picking something to watch on Netflix and it’s usually whatever image grabs my attention. Read all about it here.